
Local OpenTelemetry Demo on macOS with kind & Podman Desktop
Introduction
This article describes how to run the OpenTelemetry Demo locally on macOS using a Kubernetes cluster provisioned with kind and containerized with Podman Desktop.
The setup is designed for reproducible, local, scientific experiments in observability and cloud-native monitoring. It mirrors a realistic microservice-based environment while remaining fully runnable on a developer laptop.
You can view the original OpenTelemetry Demo project (source, manifests and example services) on GitHub: OpenTelemetry Demo.
Table of Contents
- Requirements
- Initial Setup and Cluster Provisioning
- Shut Down the Cluster and Demo
- Re-initialize and Restart the Cluster
- Conclusion
Requirements
- macOS (tested on macOS Sequoia Version 15.5)
- Podman Desktop https://podman.io/
- kind https://kind.sigs.k8s.io/
- kubectl https://kubernetes.io/docs/tasks/tools/
- Helm https://helm.sh/
- k9s (optional) https://k9scli.io/
Initial Setup and Cluster Provisioning
The following steps guide you step by step through the complete local setup – from preparing Podman Desktop to provisioning a kind-based Kubernetes cluster and deploying the OpenTelemetry Demo.
Tested environment
This setup was tested on two different Apple Silicon devices:
- Apple MacBook Pro M1 (16 GB RAM, 2021)
- Apple MacBook Air M1 (2020)
Although both machines use the same CPU architecture, the optimal Podman machine and kind cluster configuration differed slightly to achieve stable performance. The specific adjustments are documented in the step-by-step setup below.
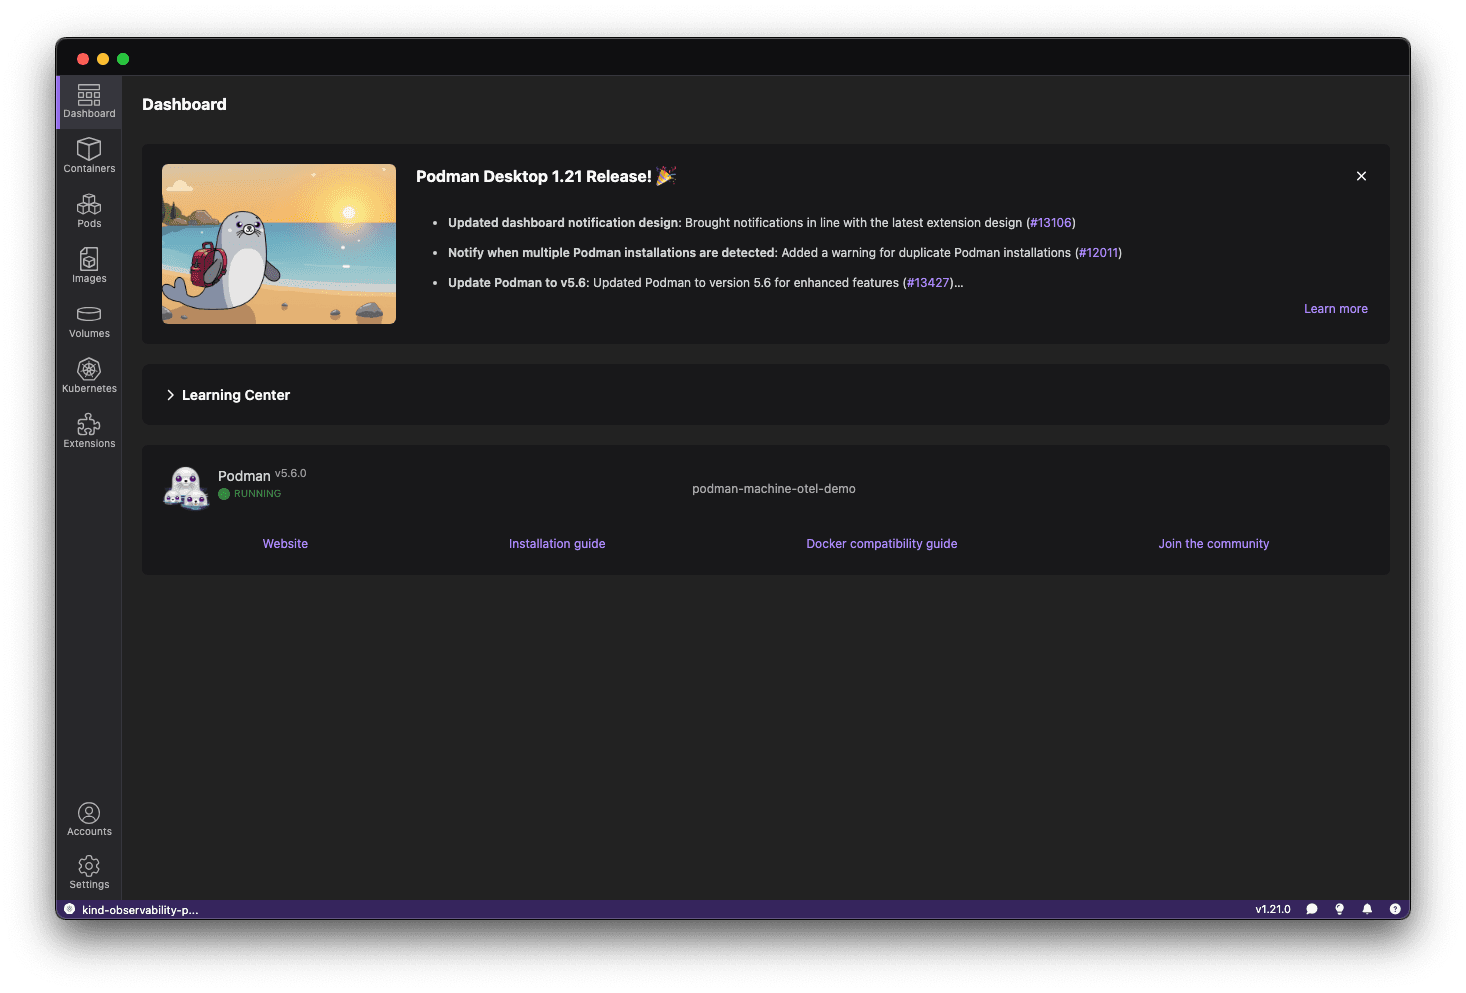
1. Start Podman Desktop
Open the Podman Desktop application on macOS. This initializes the environment so you can create a new Podman machine in the next step.
2. Create Podman Machine (VM)
# Apple MacBook Pro M1 16 GB 2021:
podman machine init podman-machine-otel-demo --cpus 8 --memory 10248 --disk-size 150

# Apple MacBook Air M1 2020:
podman machine init podman-machine-otel-demo --cpus 8 --memory 8192 --disk-size 150
3. Start Podman Machine
Start the Podman VM via the Podman Desktop App or by running:
podman machine start podman-machine-otel-demo
4. Create kind Cluster
⚠️ Important Notice The following environment variable tells kind to use Podman instead of Docker as the container runtime. This may be required on macOS systems where both Docker Desktop and Podman Desktop are installed.
export KIND_EXPERIMENTAL_PROVIDER=podman
# Apple MacBook Pro M1 16 GB 2021:
kind create cluster --name observability-platform --config kind-config.yaml

# Apple MacBook Air M1 2020:
kind create cluster --name observability-platform
kind: Cluster
apiVersion: kind.x-k8s.io/v1alpha4
nodes:
  - role: control-plane
    kubeadmConfigPatches:
      - |
        kind: InitConfiguration
        nodeRegistration:
          kubeletExtraArgs:
            system-reserved: "memory=128Mi"
            kube-reserved: "cpu=100m,memory=128Mi"
            eviction-hard: "memory.available<100Mi,nodefs.available<10%"
These kubelet options reserve CPU/memory for the OS and Kubernetes system components and set an eviction threshold, preventing pods from starving system processes and causing eviction storms. They are applied to the node's kubelet via the kubeadmConfigPatches → kubeletExtraArgs in the kind-config.yaml snippet above, so the kubelet enforces the reservations and eviction behavior. On the M1 Pro (larger Podman VM / higher pod density) explicit reservations improved stability; on the M1 Air (smaller VM) the reservations reduced allocatable memory too much, so the Air ran more stably without them.
5. Create Kubernetes Namespace
This namespace isolates all OpenTelemetry Demo resources, keeping the cluster organized and avoiding conflicts with other workloads.
kubectl create ns observability
6. Add the OpenTelemetry Helm Chart Repository
In this step, you add the official OpenTelemetry Helm chart repository to your local Helm configuration. This allows Helm to locate and download the OpenTelemetry Demo chart in the next steps.
helm repo add open-telemetry https://open-telemetry.github.io/opentelemetry-helm-charts
If you've already added the repo, run helm repo update to fetch the latest chart metadata.
helm repo update
8. Install the OpenTelemetry Demo Using Helm
⚠️ Important Notice
Before starting the OpenTelemetry Demo Kubernetes cluster with kind, please close other applications such as browsers, IDEs, or heavy background processes. This ensures enough CPU and memory resources are available and avoids pod crashes or slow startup.
💡 Tip for laptop users
Running Kubernetes workloads locally is CPU- and memory-intensive. It is strongly recommended to plug your device into power, as macOS may throttle performance in battery mode.
Install the OpenTelemetry Demo
Run this command to install into the observability namespace:
helm install observability-platform-demo open-telemetry/opentelemetry-demo --version 0.37.1 --namespace observability
Why a fixed version?
A specific version (0.37.1) is used to ensure reproducibility and consistency for scientific evaluation. Helm chart versions may change over time and introduce breaking changes.
To install the latest available version instead:
helm install observability-platform-demo open-telemetry/opentelemetry-demo --namespace observability
To view all available versions:
helm search repo open-telemetry/opentelemetry-demo --versions
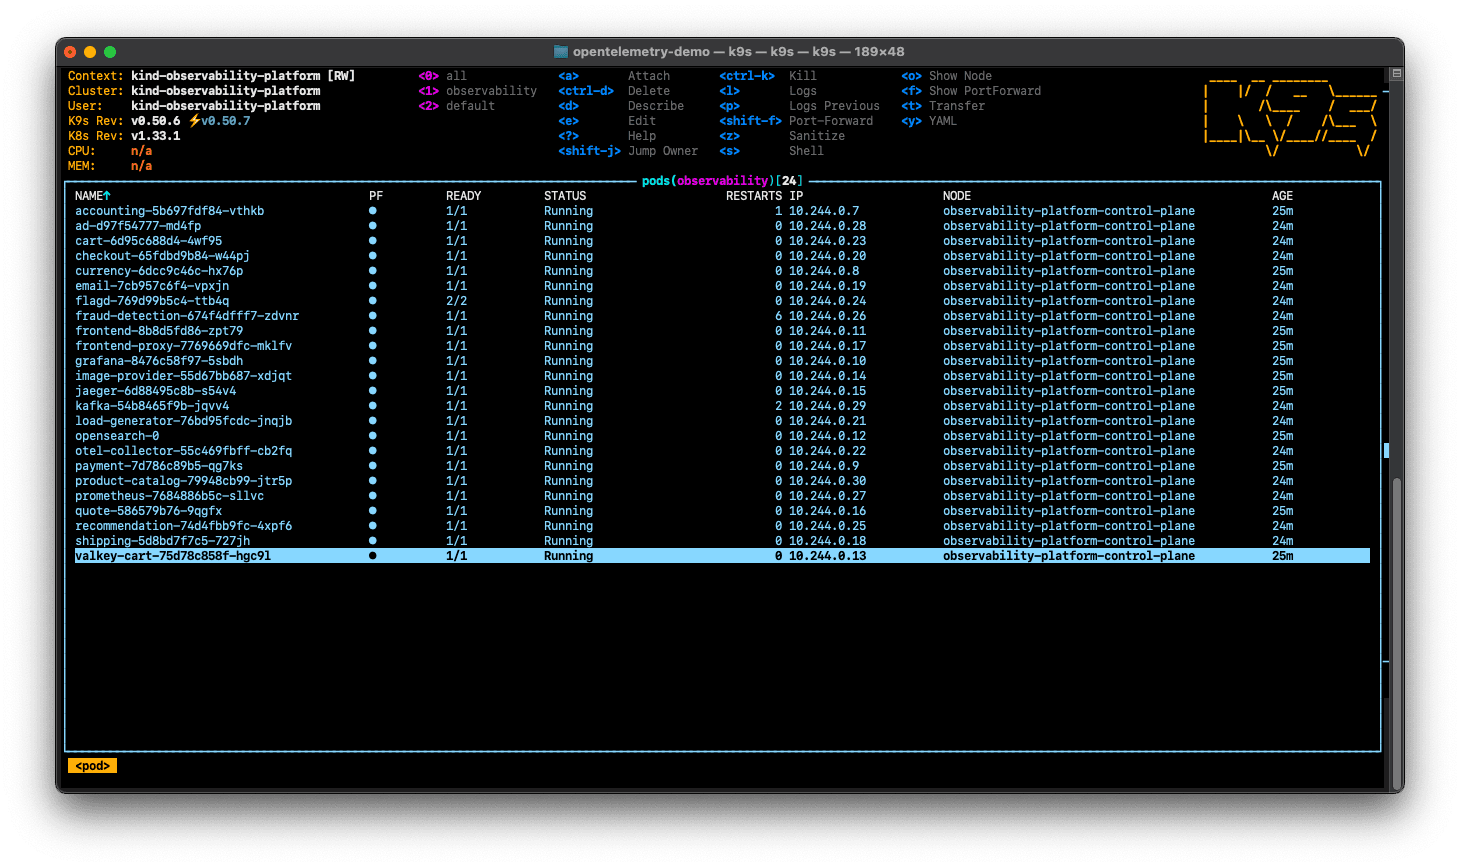
9. Observe the Cluster Startup with k9s
In a new terminal tab, you can monitor the startup of the Kubernetes cluster using k9s. This helps you verify that all pods are initializing correctly after executing the Helm install in step 8.
k9s --context kind-observability-platform
This will open a terminal-based UI where you can see the pods and their status live. Wait until all pods are in a Running or Completed state before proceeding. This startup process takes several minutes.
10. Port Forwarding
To access the individual components of the OpenTelemetry Demo via your web browser the frontend-proxy service can be used. Run the following command to make the services available:
kubectl port-forward service/frontend-proxy 8080:8080 --namespace observability
Available Web Interfaces
The following web interfaces are accessible locally through port forwarding:
| Service | URL | Description |
|---|---|---|
| Web Store | http://localhost:8080 | Demo frontend of the web shop |
| Grafana | http://localhost:8080/grafana | Metrics & dashboards |
| Feature Flags | http://localhost:8080/feature | Feature flag management |
| Load Generator | http://localhost:8080/loadgen/ | Simulated traffic (Locust) |
| Jaeger | http://localhost:8080/jaeger/ui | Distributed tracing |
Prometheus
To access the Prometheus web UI, forward its service in a separate terminal tab using:
kubectl port-forward svc/prometheus 9090:9090 --namespace observability
| Service | URL | Description |
|---|---|---|
| Prometheus UI | http://localhost:9090 | Monitoring and alerting system for metrics collection and querying |
Alternative: Forward Each Service Separately
If the default port-forward through frontend-proxy does not work or you want to access individual services directly, you can forward each service separately in its own terminal tab. This approach can help isolate issues and gives direct access to service UIs.
# Frontend
kubectl port-forward svc/frontend-proxy 8080:8080 -n observability

# Prometheus
kubectl port-forward svc/prometheus 9090:9090 -n observability

# Grafana
kubectl port-forward svc/grafana 3000:80 -n observability

# Jaeger
kubectl port-forward svc/jaeger-query 16686:16686 -n observability
Shut Down the Cluster and Demo
To shut down the OpenTelemetry demo and the local Kubernetes cluster cleanly:
1. Stop Port Forwarding
To stop port forwarding, press Ctrl+C in the terminal where you started kubectl port-forward. Alternatively, closing that terminal will also stop the forwarding.
2. Uninstall the OpenTelemetry Demo
helm uninstall observability-platform-demo -n observability
3. Delete the Namespace
kubectl delete ns observability
4. Stop the kind Cluster
podman machine stop podman-machine-otel-demo
This also stops the kind cluster running inside Podman (No need to explicitly stop kind — it's tied to Podman's lifecycle).
Re-initialize and Restart the Cluster
If you want to restart the cluster and demo later, you can start the Podman machine again and create the kind cluster. If you want to reset everything, including the kind cluster, you can delete the cluster first:
kind delete cluster --name observability-platform
Then repeat the following steps from the initial setup:
- Start Podman Machine
- Create the kind cluster
- Create the Kubernetes namespace
- Install the OpenTelemetry Demo Using Helm
Conclusion
This local setup provides a practical, near‑production environment for learning microservice observability with OpenTelemetry. Running the demo on Kubernetes surfaces real‑world concerns—tracing, metrics, logs, resource limits and service interactions—so you gain a solid understanding of what observability requires in production. The local cluster can be resource‑hungry, so adjust your Podman/VM settings to suit your machine.